The “get off the mainframe” argument
Every few years another wave of “get off the mainframe” articles rolls through. The pitch is always the same: mainframes are ancient, expensive, staffed by people who are retiring, and everything will be faster, cheaper and better if you re-platform onto commodity cloud hardware with microservices, containers and horizontal scaling.
Some of that is true. Mainframes are expensive to run and staff. Horizontal scaling on a hyperscaler is also a killer feature. You can go from an idea to a fleet of servers in minutes, while a mainframe capacity upgrade can take months. That asymmetry is real and it matters.
But “modern” and “faster” are not synonyms. A lot of migration decisions get made as if they are.
So we put a number on the gap for one narrow, common workload: batch lookup and scoring of a large set of records. We built two systems for an apples-to-apples comparison: a mainframe-style fixed-width file store with a simple TCP daemon, and a “modern” stack of Postgres, Redis, four scoring replicas and nginx, wired up three different ways: HTTP+JSON, mutual TLS+JSON and gRPC+TLS.
From monolith to “cloud native” — at what cost?
The industry narrative of the last 15 years has been consistent: break the monolith apart, put each piece in its own service, put the services behind a load balancer, cache aggressively and add more identical boxes. This buys you:
- Elasticity. Spin up more replicas in minutes instead of waiting on a hardware backorder queue that can run to months for mainframe capacity.
- Team autonomy. Independent services can be owned, deployed and scaled by independent teams.
- Commodity hardware. You are not tied to one vendor’s proprietary boxes.
What it does not automatically buy you is speed. It definitely does not buy it for free.
Every hop you add — client to load balancer, load balancer to service, service to cache, cache miss to database — is another network round trip. Add serialization, TLS handshakes, connection pool contention and a scheduler that has to context-switch to answer you. None of that exists when the “database” is a fixed-width record on local disk in the same process doing the scoring.
The industry mostly justifies this cost with elasticity and developer velocity, not raw throughput per request. That is a legitimate trade-off. It is still a trade-off, and it is worth knowing what you are paying for.
The experiment
mainframe-sim and modern-arch are two small Go codebases in this repo
. They
implement the exact same underwriting-style scoring algorithm: 9 weighted
penalties, 3 hard-fail rules and a pass/fail/manual-review verdict. They also
use the exact same seeded dataset: 3,000,000 clients and about 10.5M
decision rows.
That means the timing difference should come from the architecture, not from one implementation secretly doing less work.
mainframe-sim offers two modes:
- File mode — a single batch process reads a plain-text file of client
IDs, looks each one up directly against fixed-width binary files on local
disk (the “mainframe” way of storing data — no database, no query
planner, just an offset calculation and a
pread), and writes fixed-width output records. The file is split across 8 worker goroutines. - Daemon mode — the same lookup/scoring engine sits behind a raw TCP, line-based protocol. A separate client process streams client IDs to it over the loopback interface with 32 concurrent connections and reads results back.
modern-arch is a conventional microservice stack: 4 identical scoring service replicas behind an nginx load balancer, a Postgres database populated from the mainframe data file, and a Redis cache-aside layer in front of it. All three flavors below point at the exact same Postgres volume (3,000,000 clients, ~10.5M decision rows) so the underlying data is identical everywhere — only the transport changes:
- HTTP+JSON — plain HTTP behind nginx, with TLS offloaded.
- mTLS+JSON — the same, but with TLS on every hop.
- gRPC+TLS — protobuf over HTTP/2, with TLS on every hop.
All five configurations scored the same 2,000,000-line client-ID file
(/tmp/score), once as generated (unsorted) and once pre-sorted, for 10
total runs. The file was generated with a single shuffle over the full
seeded client ID space, so every ID in it is guaranteed to exist in the
database and the ordering is genuinely randomized rather than just “whatever
order the generator emitted them in”:
shuf -i 1-3000000 -n 2000000 > /tmp/score
Keeping it vaguely fair
The test box has 16 logical
threads (8 cores, SMT2). To make sure no architecture was being flattered by
sitting idle on spare cores, we tuned each scenario’s client
concurrency/worker count so the combined CPU usage across every
process+container in that run (client, daemon/servers, proxy, cache,
database — everything) peaked in the 1,200-1,400% range (12-14 of 16
threads), and capped it at 1,500%. Concretely: mainframe-sim file mode
ended up at -w 128 workers, mainframe-sim daemon mode at -c 96 client
connections, HTTP+JSON at -c 48, gRPC+TLS at -c 48 -conns 8, and mTLS+JSON
at -c 64 (mTLS+JSON turned out to have a hard ceiling around 1,120-1,145%
no matter how much client concurrency we threw at it — more on that below). Every
container/process involved — all 4 scoring replicas, nginx, Postgres, Redis,
and both client and server processes for the mainframe runs — was sampled
at up to 5 Hz for CPU%, RSS memory and network bytes for the full duration
of each run.
The numbers
| scenario | variant | client done in | peak CPU (sum) | avg CPU (sum) | peak RAM (sum) | total network |
|---|---|---|---|---|---|---|
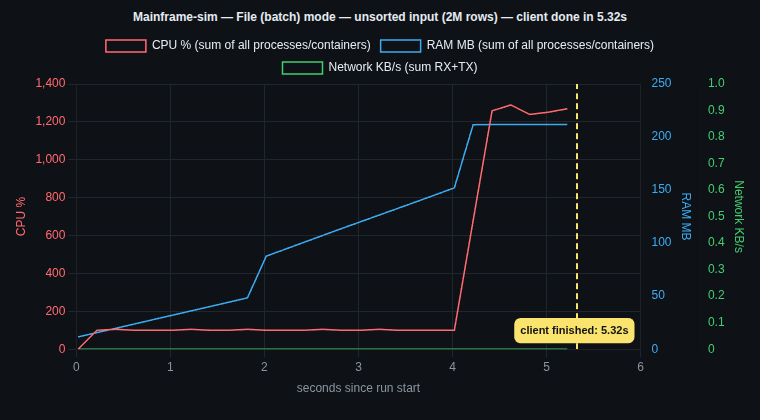
| mainframe-sim, file mode | unsorted | 5.32 s | 1289% | 334% | 212 MB | 0 |
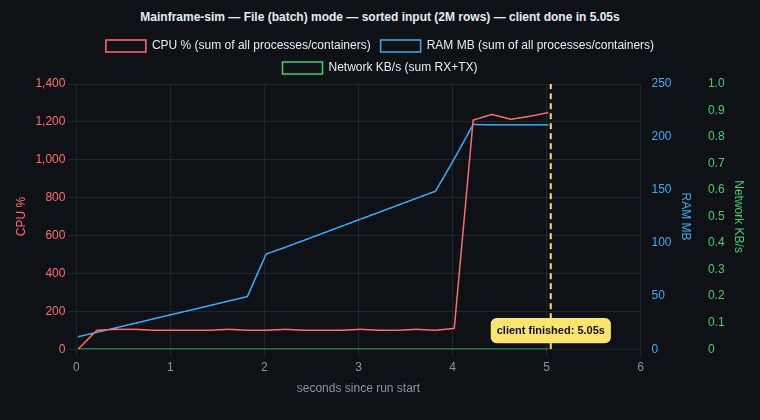
| mainframe-sim, file mode | sorted | 5.05 s | 1249% | 315% | 212 MB | 0 |
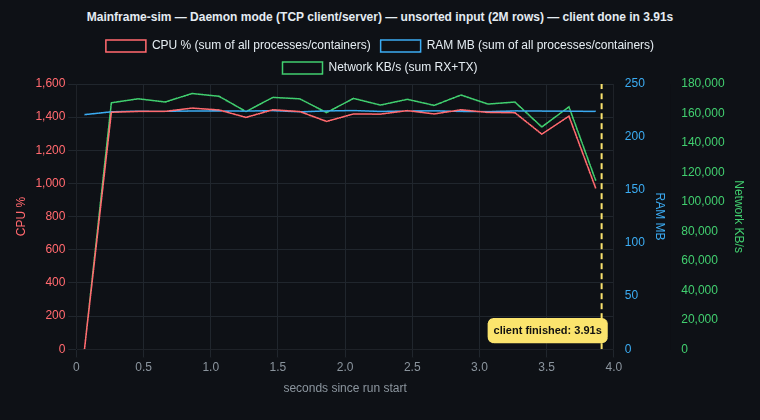
| mainframe-sim, daemon mode | unsorted | 3.91 s | 1455% | 1326% | 225 MB | 3,047 MB |
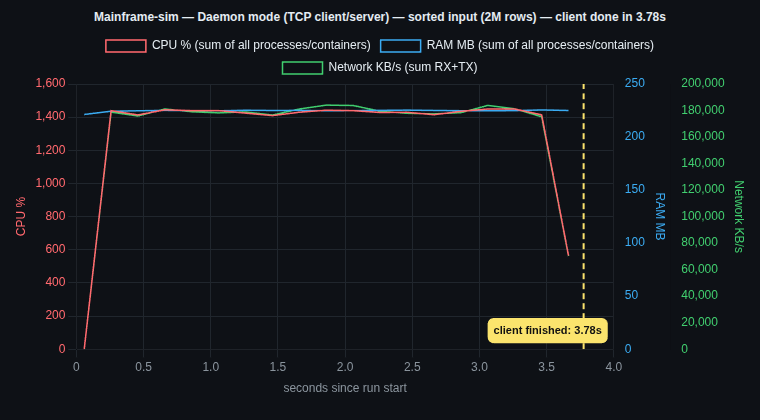
| mainframe-sim, daemon mode | sorted | 3.78 s | 1449% | 1311% | 226 MB | 3,048 MB |
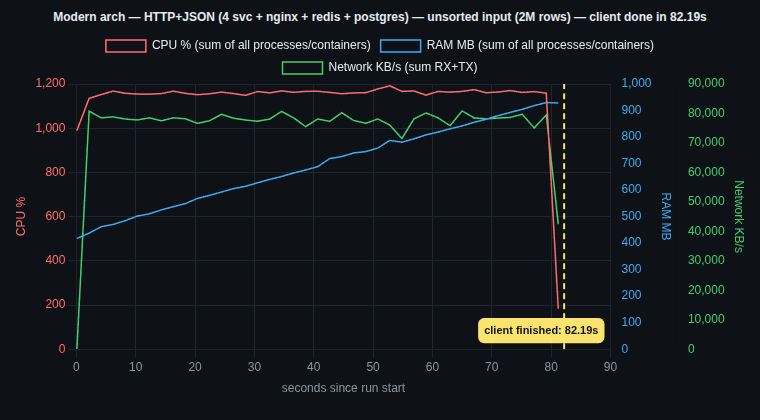
| modern-arch, HTTP+JSON | unsorted | 82.19 s | 1192% | 1134% | 930 MB | 3,014 MB |
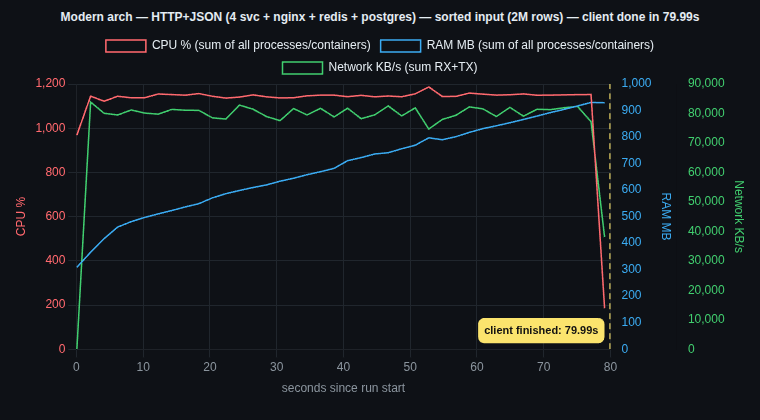
| modern-arch, HTTP+JSON | sorted | 79.99 s | 1187% | 1119% | 930 MB | 3,016 MB |
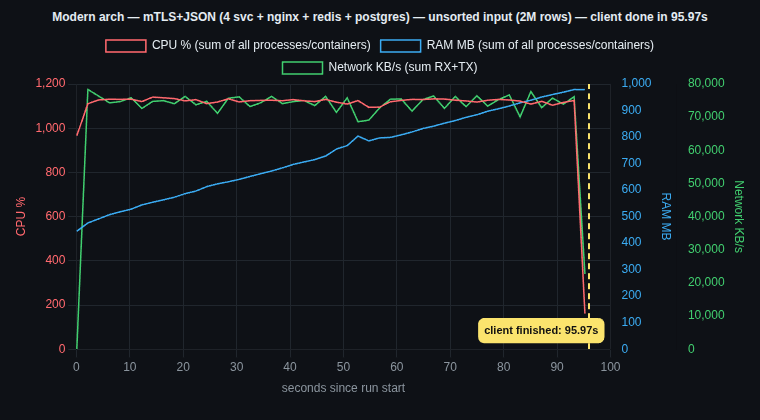
| modern-arch, mTLS+JSON | unsorted | 95.97 s | 1141% | 1100% | 979 MB | 3,365 MB |
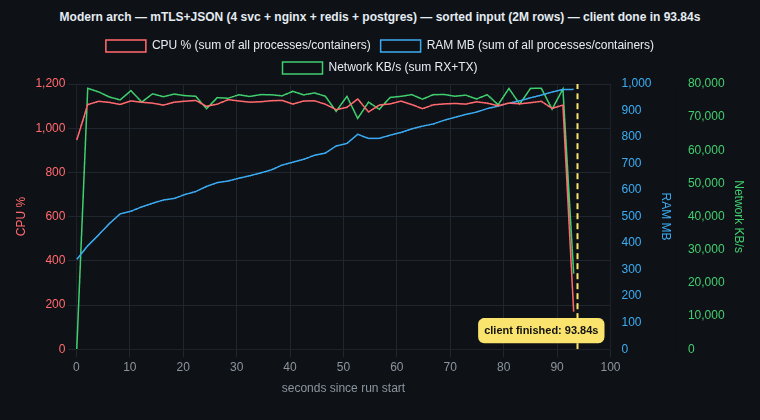
| modern-arch, mTLS+JSON | sorted | 93.84 s | 1132% | 1088% | 980 MB | 3,363 MB |
| modern-arch, gRPC+TLS | unsorted | 100.19 s | 1224% | 1185% | 1,024 MB | 3,601 MB |
| modern-arch, gRPC+TLS | sorted | 97.70 s | 1228% | 1176% | 1,025 MB | 3,608 MB |
(Full raw and processed data, plus a combined CPU/RAM/network-vs-completion-time
chart for every one of these 10 runs, is in runtime-data/ in this repo
.)
Each chart below plots CPU% (sum across every process/container involved), RAM (sum), and network I/O (sum) against wall-clock time, with a dashed vertical line marking the moment the client finished processing the file:
mainframe-sim, file mode
mainframe-sim, daemon mode
modern-arch, HTTP+JSON
modern-arch, mTLS+JSON
modern-arch, gRPC+TLS
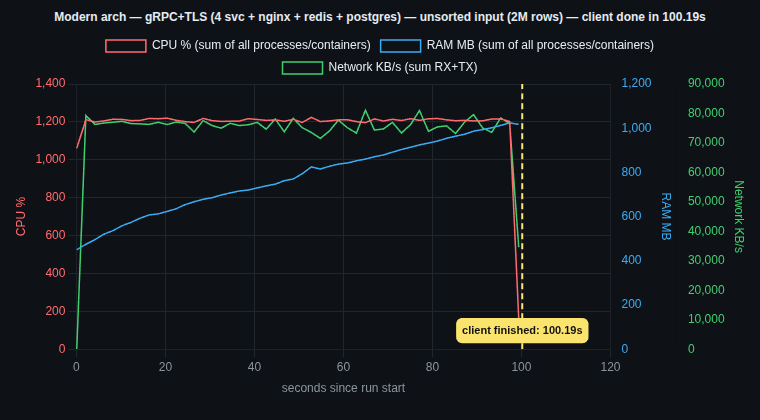
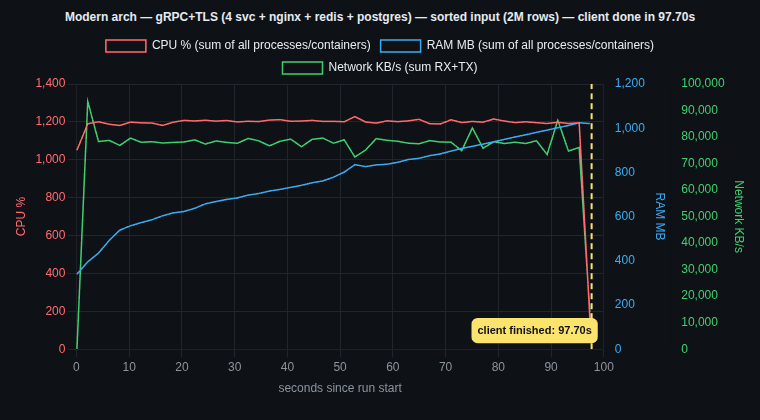
A few things jump out:
The mainframe daemon beat every modern-arch flavor by 20-26x, while using roughly the same peak CPU (all scenarios were deliberately tuned to sit in the same 1,200-1,450% band) and a fraction of the RAM — 225 MB vs. 930 MB-1,024 MB — with five fewer moving parts (no nginx, no Postgres, no Redis, no 4-way replica fan-out — just one daemon process and one client). That’s the headline: for the same slice of the same 16-thread machine, the mainframe-style design finished 20-26x more work per second.
Sorting the input mattered much less than we expected once concurrency was
high enough to hide disk latency. At low worker counts (our first pass, not
shown above) sorted file-mode input was 2.6x faster than unsorted, because
sequential access to the fixed-width store plays nicely with page cache and
read-ahead. But once we pushed file mode to 128 workers to hit the CPU
target, enough requests were in flight simultaneously that disk-order
stopped being the bottleneck — sorted and unsorted converged to within 5%
of each other (5.05s vs. 5.32s). The lesson isn’t “sorting doesn’t matter,”
it’s that concurrency and data locality are two different ways to hide
the same latency, and they substitute for each other — you can get the
sorted-input speedup for free by parallelizing instead, right up until you
run out of cores. Modern-arch showed the same pattern for a different
reason: Postgres has an index on (client_id, ts desc, id desc) and Redis
cache-asides the hot path after the first pass, so file sort order barely
touches its actual bottleneck (network round trips, TLS handshakes,
connection pool contention) — sorted was consistently ~2-3s faster across
all three modern-arch flavors, a rounding error next to their 80-100s totals.
Every layer added cost, and one of them hit a hard ceiling. HTTP+JSON < mTLS+JSON < gRPC+TLS for wall-clock time (gRPC’s numbers are worse mostly because our client could only open a handful of HTTP/2 connections — nginx pins one connection to one worker process, so gRPC’s multiplexing advantage never got to spread across as much parallelism as HTTP/JSON’s independent TCP connections did). More interesting: mTLS+JSON refused to go past ~1,120-1,145% combined CPU no matter how much client concurrency we threw at it — we tried 32, 48, 64, 96 and 128 concurrent client connections and the peak barely moved. HTTP+JSON and gRPC+TLS both scaled cleanly into the 1,200%+ target band with more concurrency; mTLS+JSON’s extra layer of certificate verification on every hop (client↔nginx↔scoring↔Postgres/Redis) creates a serialization point that additional client threads can’t route around. That’s a genuine architectural finding, not a benchmark artifact: mutual TLS doesn’t just add a constant tax, it caps how much of the box you can actually put to work.
The one place we let modern-arch show off: adding capacity
Everything above is deliberately unfair to modern-arch in one specific way: it only measures steady-state throughput on a fixed number of nodes, which is exactly the mainframe’s home turf. It says nothing about the other half of the pitch from the intro — “online in minutes vs. online in however deep the backorder queue is.” So we ran one more, much smaller experiment: starting from the already-running 4-replica HTTP+JSON stack, how long does it take to bring up a 5th scoring replica — same image, same network, real Postgres+Redis connections — and have it pass its own health check and serve a real, database-backed score?
0.167 seconds from docker run to a passing /healthz. 0.216
seconds to a real /score/{id} response with a correct DB-backed answer.
That’s the number that doesn’t show up anywhere in the mainframe’s favor:
adding an entire extra unit of capacity to modern-arch is faster than a single
network round trip in some of the scenarios above. We didn’t attempt to
simulate the mainframe side of that comparison (procurement lead times
aren’t a benchmark, they’re a supply chain), but the asymmetry the intro
described is real and this is the closest we can get to putting a number on
it locally: modern-arch can add a whole additional unit of serving
capacity in under a quarter of a second; mainframe capacity changes are
measured in weeks to months. (Raw data: runtime-data/scaleup.marker.json.)
Why the mainframe wins this workload
None of this means microservices are a mistake. It means this specific workload — high-volume point lookups keyed by ID, batch-oriented, latency sensitive, low write ratio — is precisely the shape of problem that direct-attached, fixed-width record files were designed to solve, and it punishes every network hop and serialization step you insert between the lookup and the answer. A modern stack pays:
- A TCP+TLS handshake (or reused connection contention) per request hop.
- JSON or protobuf marshal/unmarshal on both ends of each hop.
- A load balancer making a routing decision and re-encoding the request.
- A cache lookup (Redis round trip) before ever reaching the database.
- A database that has to plan, execute, and serialize a query even when the answer is “the same row as last time.”
None of these costs are wrong to pay when what you’re buying is horizontal scale-out, fault isolation, independent deploys, and the ability to add capacity in minutes rather than months. They are the wrong costs to pay silently, without measuring them, and then be “surprised” when the cloud bill and the latency numbers come in worse than the system you just replaced.
Findings
- For pure point-lookup/batch-scoring throughput, on an identical slice of the same hardware (same CPU budget, same underlying seeded data), the mainframe-style design wins by 20-26x on this dataset, using a fraction of the RAM (225 MB vs. 930 MB-1,024 MB) and 5 fewer moving parts.
- Concurrency and data locality are substitutes, not independent levers. Sorting the input file only helped mainframe file mode when it was under-parallelized; once we pushed worker count up to hit the target CPU budget, sort order stopped mattering because there was always another request ready to hide the next disk seek. The same is true, for a different reason, on modern-arch: an index + cache in front of the data makes input-file order almost irrelevant, because the real bottleneck moved from disk to network.
- Every security/observability layer (TLS, mTLS, additional proxies) has a real, measurable cost — and mutual TLS specifically hit a hard concurrency ceiling (~1,120-1,145% combined CPU, full stop, regardless of client concurrency) that plain HTTP and gRPC did not. That’s worth knowing before you mandate mTLS everywhere for a latency-sensitive path: it isn’t just slower, it has a lower achievable throughput ceiling on the same hardware.
- Horizontal scale-out is a genuine, mainframe-losing advantage — just
not for this benchmark. We measured it directly: adding a whole extra
scoring replica to modern-arch, from
docker runto serving a real, database-backed answer, took 0.22 seconds. The moment the workload exceeds what a single well-tuned batch/daemon process can push through, or requires zero-downtime rolling deploys, or needs to burst from 4 replicas to 400 in five minutes for a traffic spike, the modern stack wins outright, and no amount of mainframe tuning fixes a hardware backorder queue. The right question isn’t “which architecture is faster” in the abstract, it’s “does this specific workload need elasticity enough to be worth the per-request tax.” - “We moved off the mainframe and everything got slower and more expensive” is not automatically a sign that the migration was wrong — it might just mean nobody measured the per-hop cost of the new design before shipping it, and paid for elasticity they didn’t end up needing.
Final words
I think in this example and many more like this, one should actual say: “You don’t have a mainframe?! Don’t you get bored scrolling on your phone all day while you wait for stuff to finish?”
Tools used
- Go 1.25.5 — build toolchain for both codebases (mainframe-sim’s
go.modtargets Go 1.23, modern-arch’s targets 1.25.5; both were built and run with the installed 1.25.5 toolchain). - Docker 29.8.1 / Docker Compose v5.5.1 — running the 3
modern-arch stacks (
docker-compose.yml,docker-compose-secure.yml,docker-compose-grpc.yml), each with its own project name (mf-http,mf-tls,mf-grpc) so they could be brought up/down sequentially without colliding. - PostgreSQL 16 (alpine) and Redis 7 (alpine) — modern-arch’s
datastore and cache-aside layer, using one shared seeded Postgres volume
across all three modern-arch flavors. Seeded via the repo’s
cmd/seed_pgtool (3,000,000 clients / 10,496,971 decision rows) from the same source files used to generate mainframe-sim’s data. - google.golang.org/grpc v1.83.2 and google.golang.org/protobuf v1.36.12 — the gRPC+TLS transport.
- github.com/jackc/pgx/v5 v5.10.0 and github.com/redis/go-redis/v9 v9.22.0 — Postgres and Redis clients inside the scoring services.
- nginx (alpine) — load balancer / TLS terminator / mTLS & gRPC proxy in front of the 4 scoring replicas.
- Python 3.12.3 — the
scripts/monitor.pysampler (up to 5 Hz), readingdocker statsfor containers and/proc/<pid>/stat+/proc/<pid>/statusfor host processes, andscripts/process.pyfor turning raw samples into chart-ready time series.scripts/scaleup.pymeasures the capacity-add scenario. - Node.js v18.19.1, Chart.js v4.5.1 and chartjs-plugin-annotation v3.1.0 — rendering the combined CPU/RAM/network + completion-time charts as self-contained HTML, screenshotted to PNG via a headless Playwright browser page.
- pidstat / procfs — cross-checked CPU/RAM sampling against
/procfor the two mainframe-sim processes (batch process, daemon, and client). shuf(GNU coreutils) — generated the 2,000,000-row randomized input file (shuf -i 1-3000000 -n 2000000 > /tmp/score), thensort -nproduced the pre-sorted variant used for the “sorted” runs.
All raw samples (*.raw.csv), per-run markers (*.marker.json), processed
series (*.chart.json), HTML reports (*.chart.html) and PNG charts
(*-graph.png) for all 10 runs are checked into runtime-data/ in this
repo
, along with a summary.csv
rolling up peak/average CPU, RAM and network per scenario, so the numbers in
this post can be independently re-derived or re-plotted.